Nimm's Journal, 20 September 2012

I've noticed several journal entries lately where people are reacting - usually with stress - to daily changes in the scale. At this point, I'm just about convinced that misinterpreting weight changes as changes in body mass is one of the biggest obstacles to successful long-term changes in body composition. Changes in total body fat just don't happen that quickly, except in extreme or unusual circumstances (think, The Biggest Loser). It's not quite as bad as turning an oil tanker around, but it's close. If you have a few slices of "indulgence" pizza, the 2 pounds you gain on the scale next day will not be body fat. Some of it might be, or none. You might even have less body fat, despite the uptick. But you didn't add 2 pounds of fat overnight.

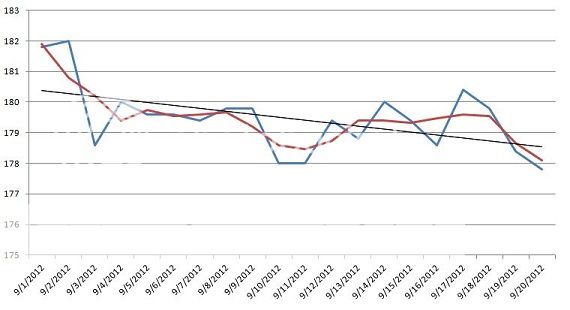
Anyway, here's my weight chart since the beginning of September:


It was Sep 2 that I decided to switch from bulking at 3200 cal/day, down to a cut. The first week I was averaging around 2500/day. The second I moved it down to 2400. This week, I'm around 2300 to 2350. At the rate I had been adding mass during the bulk, it seemed that I was burning between 2900 and 3000 calories per day. Unless I slowed down my non-exercise activity once I began restricting calories (and I think I may have), I would expect that my deficit since September 3 would have resulted in about 2.5 lbs of fat loss.

Back to the chart. The day after I cut back, I dropped down to 178.5. Amazing! But obviously just a big change in my glycogen and water levels. Two weeks later, on September 17, I was 180.4. If I just compared these two plot points, my cut was starting horrendously. After two weeks of restricted calories, I was 2 lbs heavier.

This is what the trendline is for. Smoothing that chart out, Excel thinks I've lost...just about 2 pounds. Right in the ballpark of where I should be.

And this is why the process takes a lot of patience. Even though the scale was 2 pounds higher on Sep 17 than Sep 3, I had actually lost about 2 lbs of fat. If there's one feature I wish FatSecret would add to help maintain its users' collective sanity, it would be tools for showing the actual trends in a weight chart that will always follow a sawtooth pattern.

In the meantime, there's always Excel.

Diet Calendar Entry for 20 September 2012:
2224 kcal Fat: 77.60g | Prot: 179.20g | Carb: 255.22g.   Breakfast: almonds, apple, spinach, vegetable medley, carlson fish oil, meijer lowfat cottage cheese, dannon light & fit greek cherry. Lunch: dry roasted peanuts, plum, quest bar, carrot, kraft string, spinach. Dinner: Ultimate Chicken Grill Fillet, Chili (Small). Snacks/Other: nature valley protein, Sweet Potato Chips, meijer lowfat cottage cheese, dark chocolate dreams, quest bar, extra gum, Lo-carb Monster Energy. more...

   Support   

Comments 
As one of those journalers freaking out over "overnight" weight gain, I just want to say thanks for the informational and sanity conserving post. 
20 Sep 12 by member: lynette86
What a great entry Nimm. It really puts things in perspective when you can actually dissect the trends through the historical data. I probably should check this before I state it but it would be great to export weight data and import into Excel. Did you use an RMS formula to calculate through the spike variations? I take it that would be the best way for rate of change. As for me, I can see how easily I can get caught up in the "moment" and how it affects my perspective on my performance. Seeing this entry is great for me to realize that I continually need patience, especially when I am going opposite of you and trying to gain mass in hopes of not gaining most of it as fat. Keep up the great work and info buddy! 
20 Sep 12 by member: gerdik
Great information! I am just starting (again) an aggressive weight training program to add to my usual cardio. I know what you say is true - so I will remain optimistic even though I have so much fat to lose and muscle to gain. Phew! 
20 Sep 12 by member: Neptunebch
gerdik - In this case, it was literally as simple as just selecting the "Add Trendline" option once I had the chart formatted. Excel has a lot of other options, but this one is simple and works reliably enough for me not to bother with anything more involved. At least, that's my excuse for just not being very good with statistics. :) 
20 Sep 12 by member: Nimm
Neptunebch - That's great to hear; I think you'll find weight training very rewarding not just for how you look, but especially how you feel. My wife started easing into lifting 5 weeks ago and she loves it (or at least claims to....) The only warning I'd give is that of all the women I know how picked up weights, every one of them found that the scale increased by a few pounds in the first month or two. And this is where I think the point of my update is especially important - you will be changing your body composition for the better, regardless of what happens on the scale. You can expect to be losing some body fat while adding some lean mass, which will change your strength and size. The scale may or may not reflect that, so progress photos and/or measurements will probably be a better way to evaluate the changes. Take everything the scale tells you in the next couple of months with a large grain of salt! 
20 Sep 12 by member: Nimm


Submit a Comment


You must  sign in to submit a comment
 

Other Related Links

Members


Nimm's weight history


Get the app
    
© 2024 FatSecret. All rights reserved.